The R programming language is a GNU project, originally developed at Bell Laboratories in 1993. R traces its roots to S, a statistical programming language also developed at Bell Labs. Created first and foremost for statistical computing, R allows users to implement a variety of statistical and graphical tools that are easily expanded by third-party packages. Since creating rich plots and graphs is a core functionality of R, methods to visualize data are abundant and easily implemented.
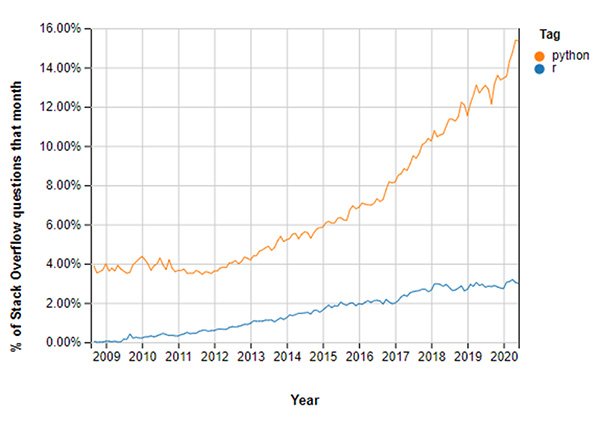
Python was introduced in 1991 by Dutch programmer Guido van Rossum and is currently maintained by the Python Software Foundation. Like R, the Python Programming Language is also free software. However, Python is open-source as well. While R was developed with the express goal of creating a statistical programming environment, Python was and is a general-purpose programming language with countless applications. Within the last eight years, we have seen an exponential rise in interest regarding Python, in part due to its popularity in the field of Data Science.
Workflow

The most popular tool for programming in R is RStudio, an integrated development environment (IDE) that includes a console and text editor that allows for code to be directly executed. RStudio is a unique platform that can work with data analysis projects from start to finish. Creating detailed and technical reports is easy with R Markdown, an extension for RStudio, that allows users to publish their work by exporting code blocks in line with markdown formatting in a notebook interface. R Markdown allows the mixed use of many languages, such as R, Python, Bash, JavaScript, CSS, and SQL, depending on the project at hand.
Since Python was not originally designed as a statistical programming language, there are many environments in which Python code can be written and run. Text editors like the classic Vim or GNU Emacs can create and save .py files, and these files can be run in the Windows Powershell or Mac/GNU Linux Terminal. However, with the rise in popularity of Python has come the need for more specialized tools for efficient Python data manipulation, analysis, and modeling. PyCharm, a Python IDE developed by JetBrains, is geared toward developers and performs analysis tasks directly with its built-in Python console. One of the most popular approaches to data science in Python is using Notebooks. IPython (Interactive Python) was originally released in 2001 as an interactive shell for programming in Python. Out of this grew Project Jupyter, an execution environment that is language agnostic, but it is commonly used with IPython in the form of a Jupyter Notebook.
While RStudio and Project Jupyter are often associated with R and Python, respectively, both platforms are not limited to use with these languages. As stated above, RStudio supports Python as well as SQL. Project Jupyter’s Jupyter Notebooks support programming in Julia, R, Haskell, Ruby, and Python. The popularity of language-agnostic platforms is growing, and polyglot notebooks, such as Netflix’s Polynote, are being developed for various data science applications.
Plotting and Visualizations

One of the keys to data analysis is the visualization of data. Both R and Python include packages that can take structured data and visualize it in various types of charts and graphs. One of the first packages that many R programmers may encounter is ggplot (currently ggplot2). This powerful plotting package translates data from a dataframe to a ggplot object such as a scatter plot, bar chart, or box and whisker plot, to name a few.
Python offers matplotlib, a package that is similar in popularity and function to R’s ggplot. From matplotlib come seaborn and plotly, two other visualization packages that improve the style of standard plots and graphs implemented through matplotlib.
Performance

For simple and common analytics tasks, there is little performance difference between R and Python. However, as with any language comparison, there are dissimilarities in the language architecture that result in different run/compile times. Dmitry Kisler, in an article from datascience+, illustrated that Python more fluently iterates through for loops, at a rate of eight times faster when iterations are less than 100. With modern hardware, average users are unlikely to notice a significant difference. When projects increase in size, cloud computing resources are often used, further decreasing the difference in performance between R and Python.
Many machine learning projects for mobile or other environments where resources are limited are created using Python and TensorFlow Lite, a framework designed specifically to deploy machine learning models on mobile and IoT (Internet of Things) devices. R has similar deployment functionalities with Shiny, a package designed for interactive data web applications. While this package is not machine learning specific, it can be used to deploy models to web-based and/or mobile devices.
Packages

Packages are collections of related classes and functions that fulfill specific purposes required by the R and Python community. In R, access to packages is made simple with The Comprehensive R Archive Network (CRAN). CRAN is a collection of slightly over 16,000 official R packages (as of July 2020) that are freely available for use. Here are five must-know packages:
If you are looking to import a SAS, S, SPSS, dBase, or Weka file into R, this is the package for you. Foreign can take these outside data formats and make them not only legible but capable of being manipulated in R.
Derived from “plyr,” dplyr is a package used for the creation and manipulation of datasets in R. Using the “<-“ operator, datasets can be created and stored in a named variable, then arranged, trimmed, and otherwise augmented as the user pleases.
Worth mentioning twice, ggplot2 is the classic graphical data visualization package. GGplot2 adds layers of data mapping functionality, including various geometric objects, facets, and scales.
Classification and Regression Training (CaReT) is a popular package that allows for the training and plotting of classification and regression models. Caret is a robust package for machine learning due to its easily interpretable syntax and a wide variety of available resources.
Working with time-series data? Zoo (Z’s Ordered Observations) is a must-have. The zoo package enables users to index and order observations for use in time series analysis projects, especially regarding uneven intervals.
Python’s packages are not as neatly collected as they are in CRAN. This is partially due to the larger number of packages in the Python Package Index (130k+) and partially due to the less focused application of Python to various other fields. This is an excellent example of the difference in a general-purpose programming language (Python) and a statistical analysis programming language (R).
Let’s look at five key packages used for data science in Python:
One of the most popular packages in Python is pandas, which allows for the reading and writing of data from files and data structures. Creating dataframes is easy, and the manipulation of data is fluid. If you have a .CSV to import, pandas is where you’ll want to begin.
NumPy is “the fundamental package for scientific computing with Python” for a reason. From n-dimensional arrays to in-depth mathematical computing tools, if there’s scientific manipulation of data to be done, chances are NumPy is involved.
Much of Python plotting is performed with matplotlib. This package allows users to create static graphs as well as interactive visualizations of data. Seaborn, a popular high-level graphing interface, is based on Matplotlib.
Tensorflow is an “end-to-end open-source machine learning platform” originally developed by the Google Brain Team for internal projects. It has since grown to one of the premier Python machine learning tools for the deployment of models locally or in the cloud.
This package is the go-to for training and deploying machine learning models for classification, regression, clustering, and many other applications. Scikit-Learn is open-source and built on NumPy, SciPy, and Matplotlib to make predictive data analysis approachable for all.
Market Share

R and Python are both growing with the field of Data Science. However, we do see a sharper increase in interest in Python. Innvonix Technologies theorizes this is due in part to the popularity of the language amongst Machine Learning Engineers.

In January 2020, it was estimated that Python was the second most popular programming language (below JavaScript), commanding 29.72% of the market, according to the 19th Annual KDnuggets Software Poll. R slipped from the top 10 but is still widely used in data analysis and statistical modeling. Many data scientists and analysts use both tools in addition to languages like SQL and other utilities like Apache Spark and Tableau (an interactive data visualization tool).
Looking Forward
Both R and Python will continue to be popular tools in the data science world for the foreseeable future. Therefore, it is advisable to learn both of these dominant languages that give you access to a wide range of practical and powerful packages, if possible. If the idea of a neatly collected repository of official packages appeals to you, you may wish to start with R. If you’re familiar with interpreted, high-level programming languages, then Python might pique your interest. After all, Python can be used for a variety of tasks, so learning the syntax could be a helpful way to break into other applications.
The University of San Diego’s Master of Science in Applied Data Science program courses (MS-ADS) are designed and offer a wide variety of modern and in-demand toolkits. Speaking of tools, we teach both languages, concurrently, in relevant courses to train the data scientists and leaders of tomorrow. We believe that it is essential for our graduates to be prepared for the challenges of an ever-changing and quickly growing field.


