Check Teacher Salary Census Data to See Where Your State Stands
How does your state fare when it comes to teacher salaries? Though there is widespread consensus that money alone does not guarantee a quality education, teacher salaries by state are often considered an indicator of the value that leaders in individual states place on public education.
Here, we will examine teacher salary ups and downs over the past two decades, using data from the National Center for Education Statistics (NCES), a division of the U.S Department of Education.
The NCES recently updated its chart reporting on public school teacher salaries by state since 1999-2000 with new numbers from the 2018-19 school year. One of the features of the chart is data examining which states have had the biggest percentage increases and decreases in teacher salaries over that nearly two-decade span.
We’ll start by reviewing the biggest percentage gains and losses in teacher salary by state (adjusted to 2018-19 dollars for an apples-to-apples comparison).
The reported national average for teacher salaries is $61,730. This represents a nominal increase of nearly $20,000 from 1999-2000; however, when adjusted for inflation and examined in 2018-19 dollars the average salary for U.S. teachers has decreased by 1.3%.
Want the Brochure for USD’s Online Master of Education Degree?
Earn your M.Ed. in just 20 months with a program designed for working professionals.
How do the numbers break down by state? The envelopes, please.

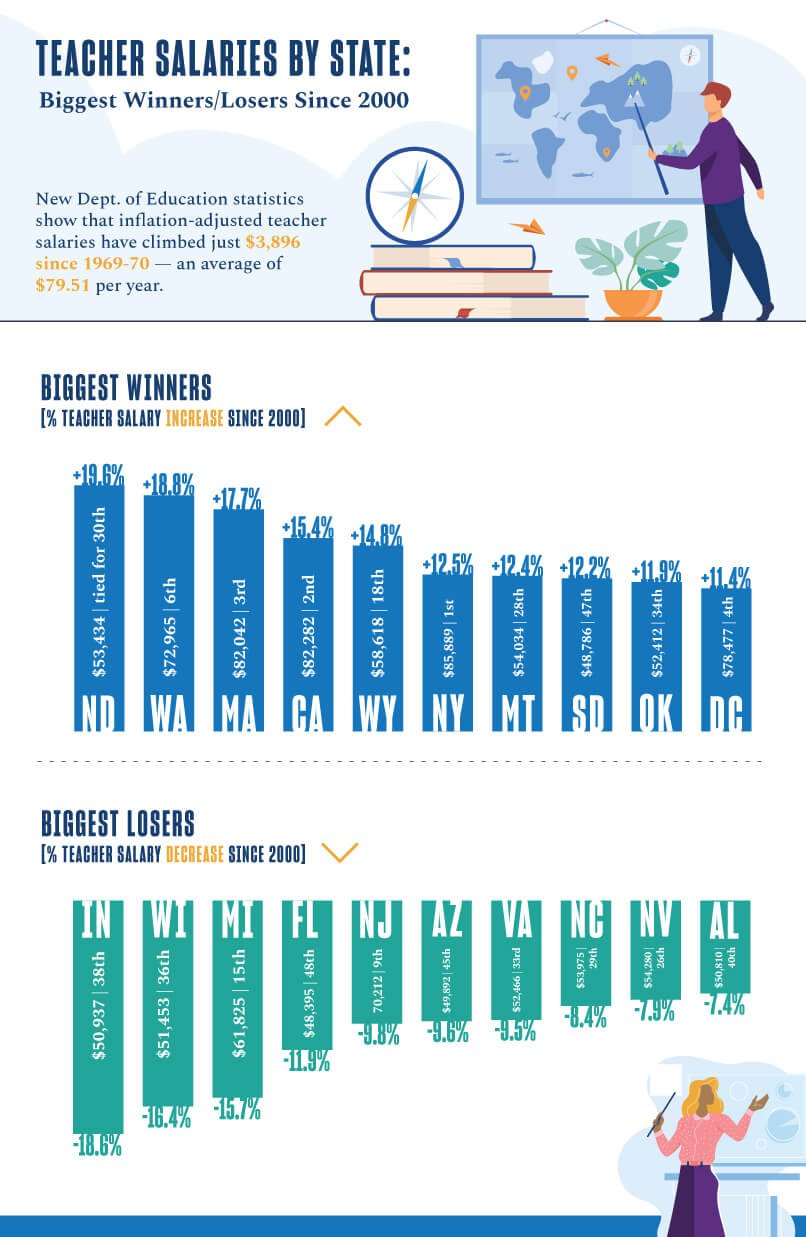
Biggest Winners [% Teacher Salary Increase Since 2000]
Along with the usual suspects like California, New York and Massachusetts, the list of “biggest winners” includes Oklahoma, Montana, Wyoming and both Dakotas, with North Dakota’s 19.6% increase topping the chart.
Five of the top gainers also rank in the Top 6 for total average salary. (Note: In addition to percentage increases, the lists below also cite the actual state average and where the state ranks.)
- North Dakota: +19.6% ($53,434 | tied for 30th)
- Washington: +18.8% ($72,965 | 6th)
- Massachusetts: +17.7% ($82,042 | 3rd)
- California: +15.4% $82,282 | 2nd)
- Wyoming: +14.8% ($58,618 | 18th)
- New York: +12.5% ($85,889 | 1st)
- Montana: +12.4% ($54,034 | 28th)
- South Dakota: +12.2% ($48,786 | 47th)
- Oklahoma: +11.9% ($52,412 | 34th)
- District of Columbia: +11.4% ($78,477 | 4th)
Are You An Educator Considering the M.Ed Path?
Read the top 11 reasons to earn your master of education degree.
Biggest Losers [% Teacher Salary Decrease Since 2000]
Among the states whose teacher salaries declined by the largest percentage in adjusted 2018-19 dollars, five also rank in the bottom third of all states for average teacher salary and all but two rank in the bottom half of U.S. states.
- Indiana: –18.6% ($50,937 | 38th)
- Wisconsin: –16.4% ($51,453 | 36th)
- Michigan: –15.7% ($61,825 | 15th)
- Florida: –11.9% $48,395 | 48th)
- New Jersey: –9.8% (70,212 | 9th)
- Arizona: –9.6% ($49,892 | 45th)
- Virginia: –9.5% ($52,466 | 33rd)
- North Carolina: –8.4% ($53,975 | 29th)
- Nevada: –7.9% ($54,280 | 26th)
- Alabama: –7.4% ($50,810 | 40th)
Where Does Your State Rank?
Overall, 20 states (including the District of Columbia) were in the plus column; but the majority — 31 states — have lost ground since the turn of the century when it comes to inflation-adjusted teacher salaries.
Take a look at the Department of Education teacher salary chart to check the numbers for your state.
[RELATED] Teacher Salaries Have Increased Significantly Over Time — Or Have They? >>
Depending on where you live and teach, the salary figures can range from somewhat encouraging to downright depressing.
“Unacceptable” was a vocabulary word that was on the minds of many U.S. teachers during the recent (pre-COVID) teacher strikes, protests and walkouts that popped up across the country (including West Virginia, Oklahoma, Kentucky, Illinois, Oregon, North Carolina, Arizona, Colorado and California) in 2018-19.
Yet the reality remains that teacher salaries are declining in real dollars. One particularly harsh way to look at the NCES numbers (using some basic subtraction and division) is that inflation-adjusted teacher salaries have climbed just $3,896 since 1969-70 — an average of $79.51 per year.
Want the Brochure for USD’s Online Master of Education Degree?
Earn your M.Ed. in just 20 months with a program designed for working professionals.
There appears to be cause for hope on the horizon. Chalkbeat.org reports growing support for higher teacher salaries (“3 out of 4 Americans Support Giving Teachers a Raise, the Highest in a Decade”). And EdWeek.org reports that at least 13 U.S. governors so far this year have proposed raising teacher pay.
Since teachers tend to prefer devoting all of their energies to educating the students in their community, most would probably rather not move to a higher-paying district or seek supplementary income through part-time work to increase their pay.
However, we would be remiss if we failed to mention that, for many teachers, earning your master’s degree is one avenue for improving your finances since many districts offer a contractual salary bump for obtaining an advanced degree.
Ongoing Thought Leadership on Teacher Issues and Trends
As a nationally ranked university with a highly regarded online Master of Education degree program, the University of San Diego keeps a close eye on a wide range of educational issues. For example, recent MEd blog post topics have included:
- Online Learning More Important Than Ever in the Face of COVID-19 Crisis
- Remote Teaching Resources for Navigating the Coronavirus Crisis
- Teaching Digital Literacy to 21st Century Students
- An Educator’s Guide to Teaching Styles & Learning Styles
Find more informative posts (and sign up for news updates) at the University of San Diego MEd blog page.


